A year ago the Elastic team released the Graph product, whose promise is to offer:
a new way to discover, and explore, the relationships that live in your data.
Here we will describe how Graph could be used on Deezer data to rebuild our “Similar Artists” feature.
What do we need ?
Elastic Cloud
Although most Elastic products are freely available, you need a license to use the Graph product. You can opt for the Elastic Cloud free trial. Sign up here and you are ready to start!
You should now provision a single cluster with 1GB memory and 16GB storage. Next you need to configure a few settings in the ‘Configuration’ section to enable Kibana.
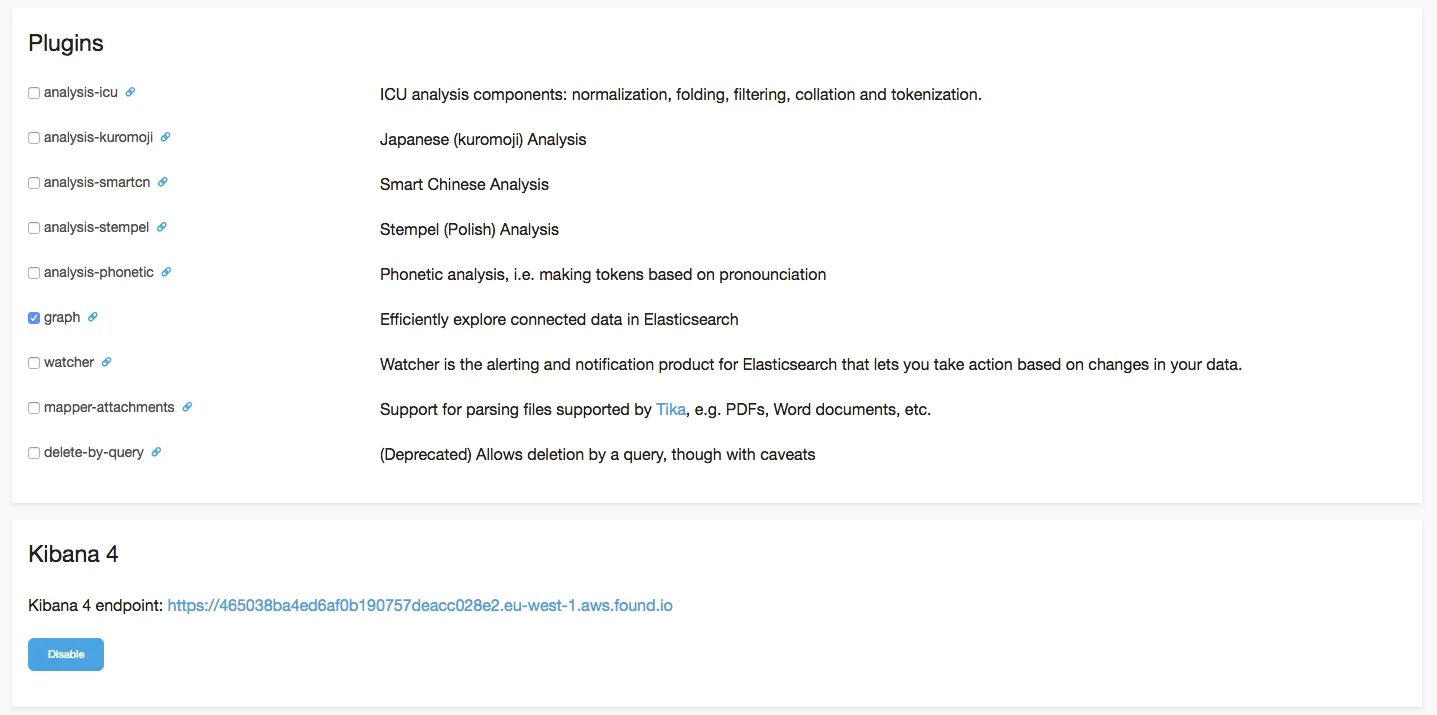
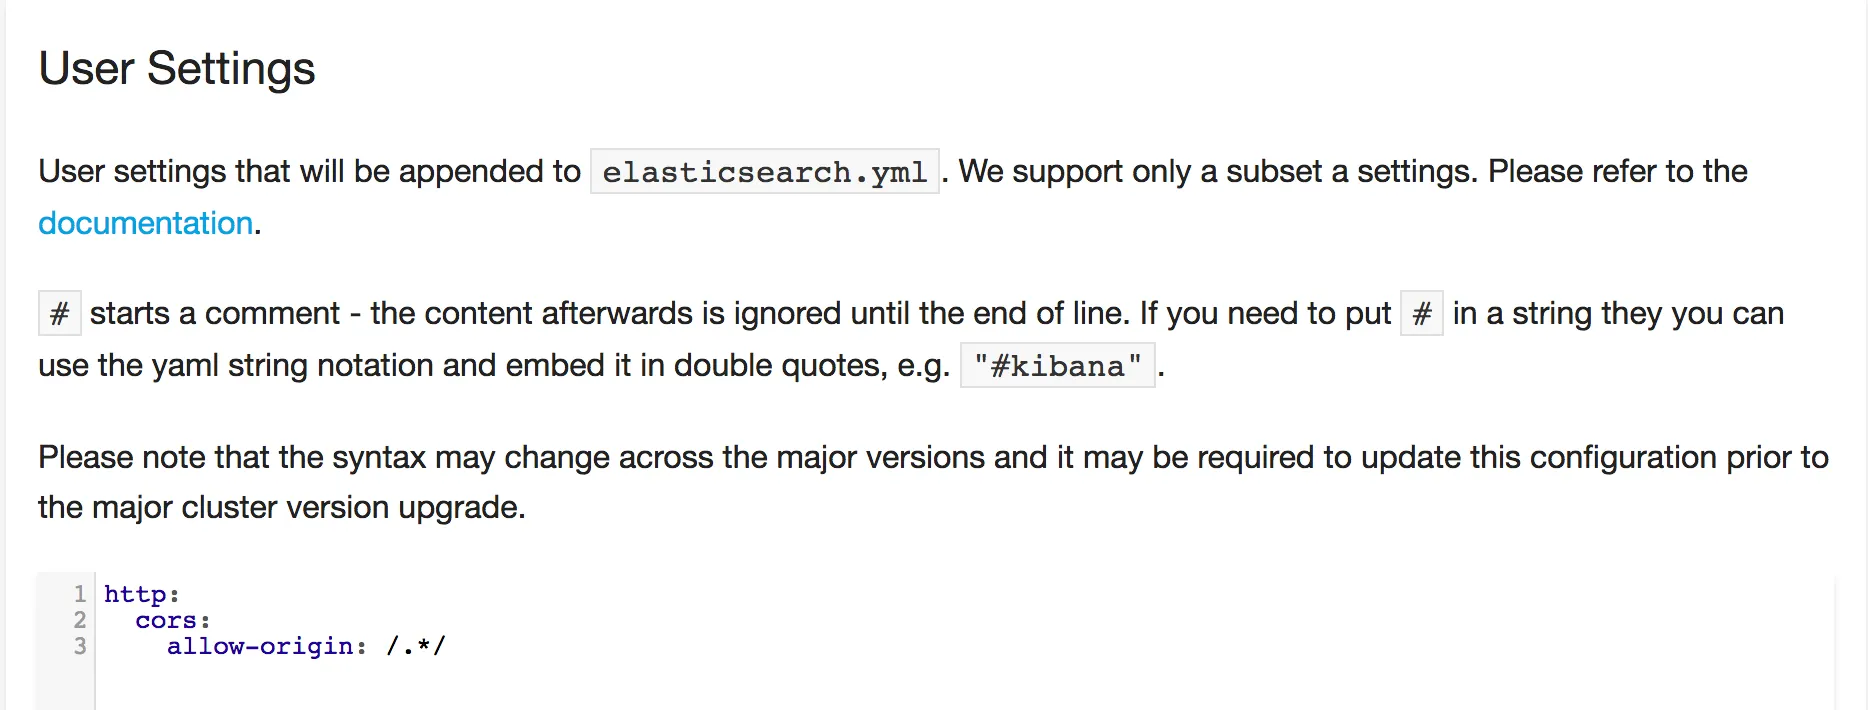
Shield configuration is mandatory, otherwise you cannot start a cluster. To get one, go to the ‘Security Editor’ section and reset the password. Then go to Kibana to create a new user with new roles.
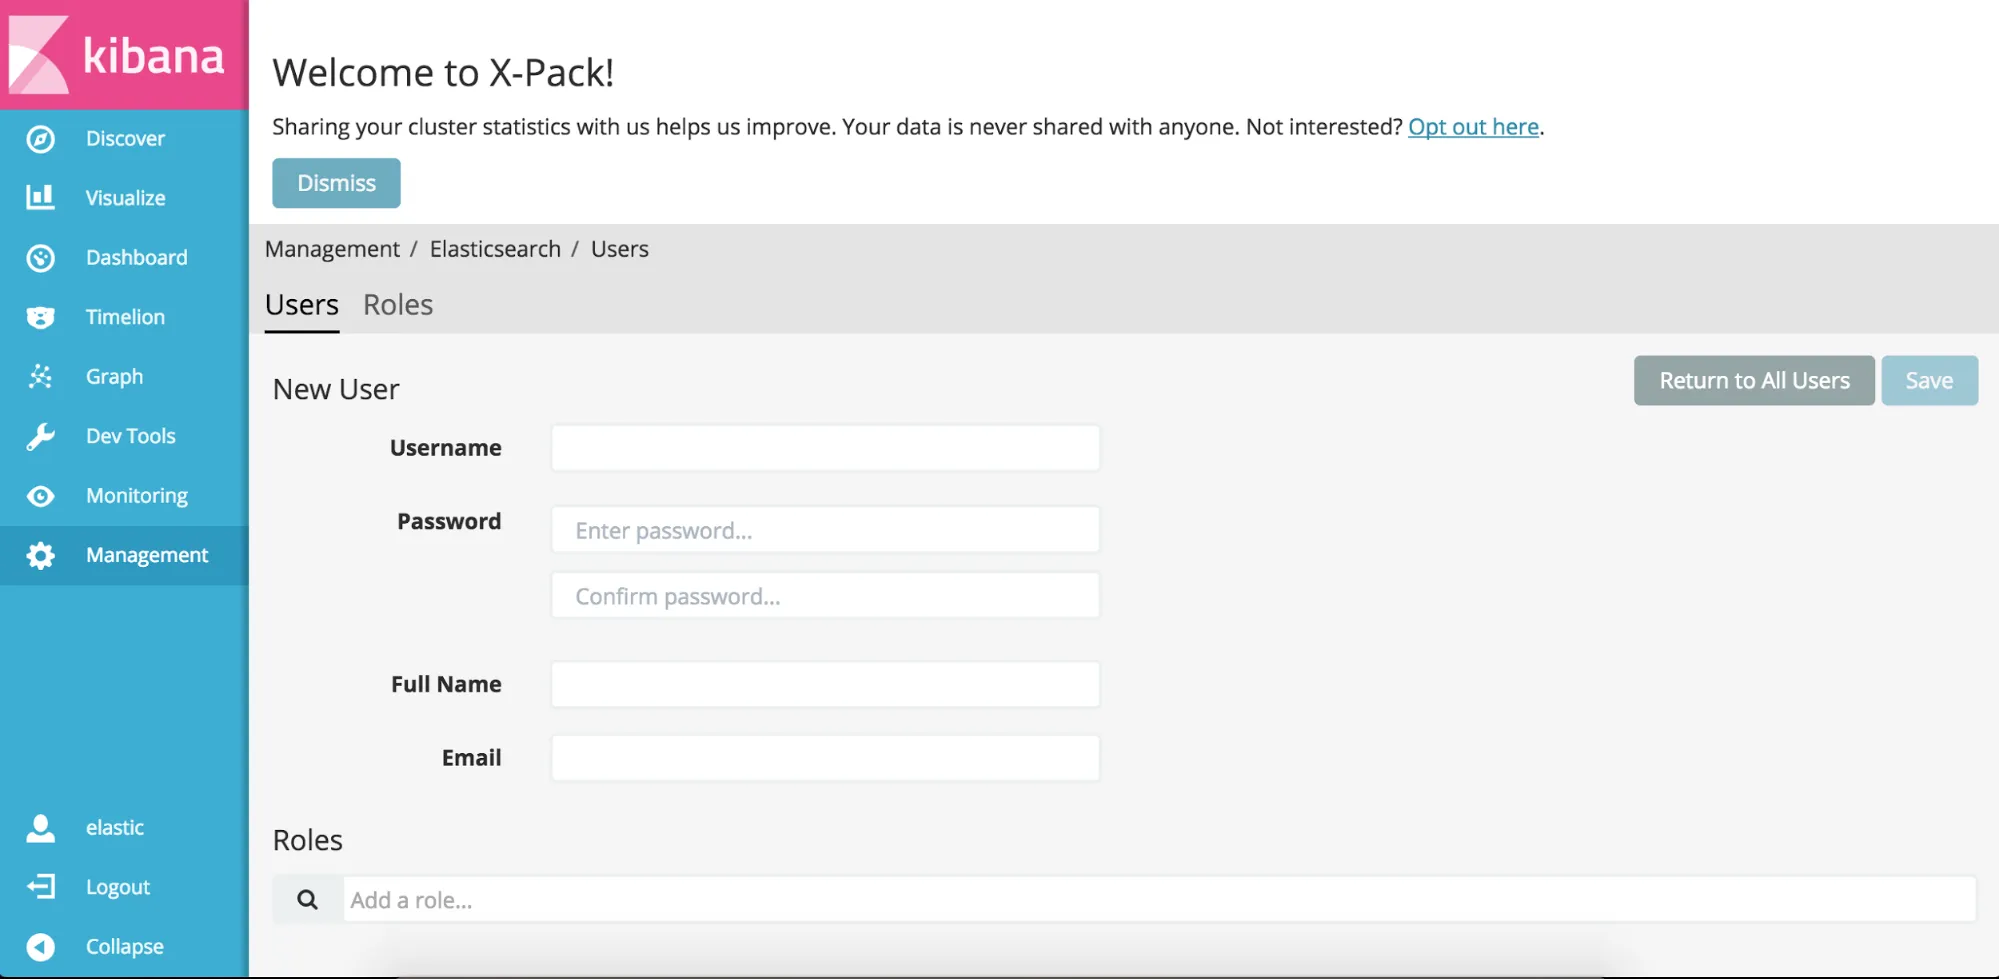
Once you complete these steps, go to Kopf — a web admin tool for Elasticsearch, check the ‘Overview’ section and observe the green cluster (see below).

Deezer Data
Now that our tools are configured, we need some data to play with. You can find the data and script used to write this article on this GitHub repository.
In order to build relations between artists, we rely on the following hypothesis : artists have a connection if the same user listens to them. Relevant connections will appear with a sufficiently large number of users.
Our dataset is composed of the ‘listened to artist’ profile of our users. Here are some data examples:

A small, anonymous dataset is provided in order to allow you to play with data in Elastic Graph. The dz_id field has been removed from the data to preserve anonymity.
Index data in Elastic Cloud
It’s now time to push our data to Elasticsearch. Even though Elasticsearch allows data indexing without setting a mapping, it is not advised. Indeed without a mapping, Elasticsearch will analyze string fields using a Standard analyzer, which could have negative effects on our project.
You can set the following settings and mapping for the dz-music index by using Sense — a browser plugin to send REST requests:
This mapping creates the users type in the dz-music index. Note that we do not analyze the artist_names field.
You can now use the bulk API to index the data sample. Here is your new indice displayed in Kopf:

Visualize data in Kibana
With our data indexed in Elasticsearch, we can now create a visualization for them. Given that Kibana is not the subject of this post, I will just explain how to configure it and how to create a visualization.
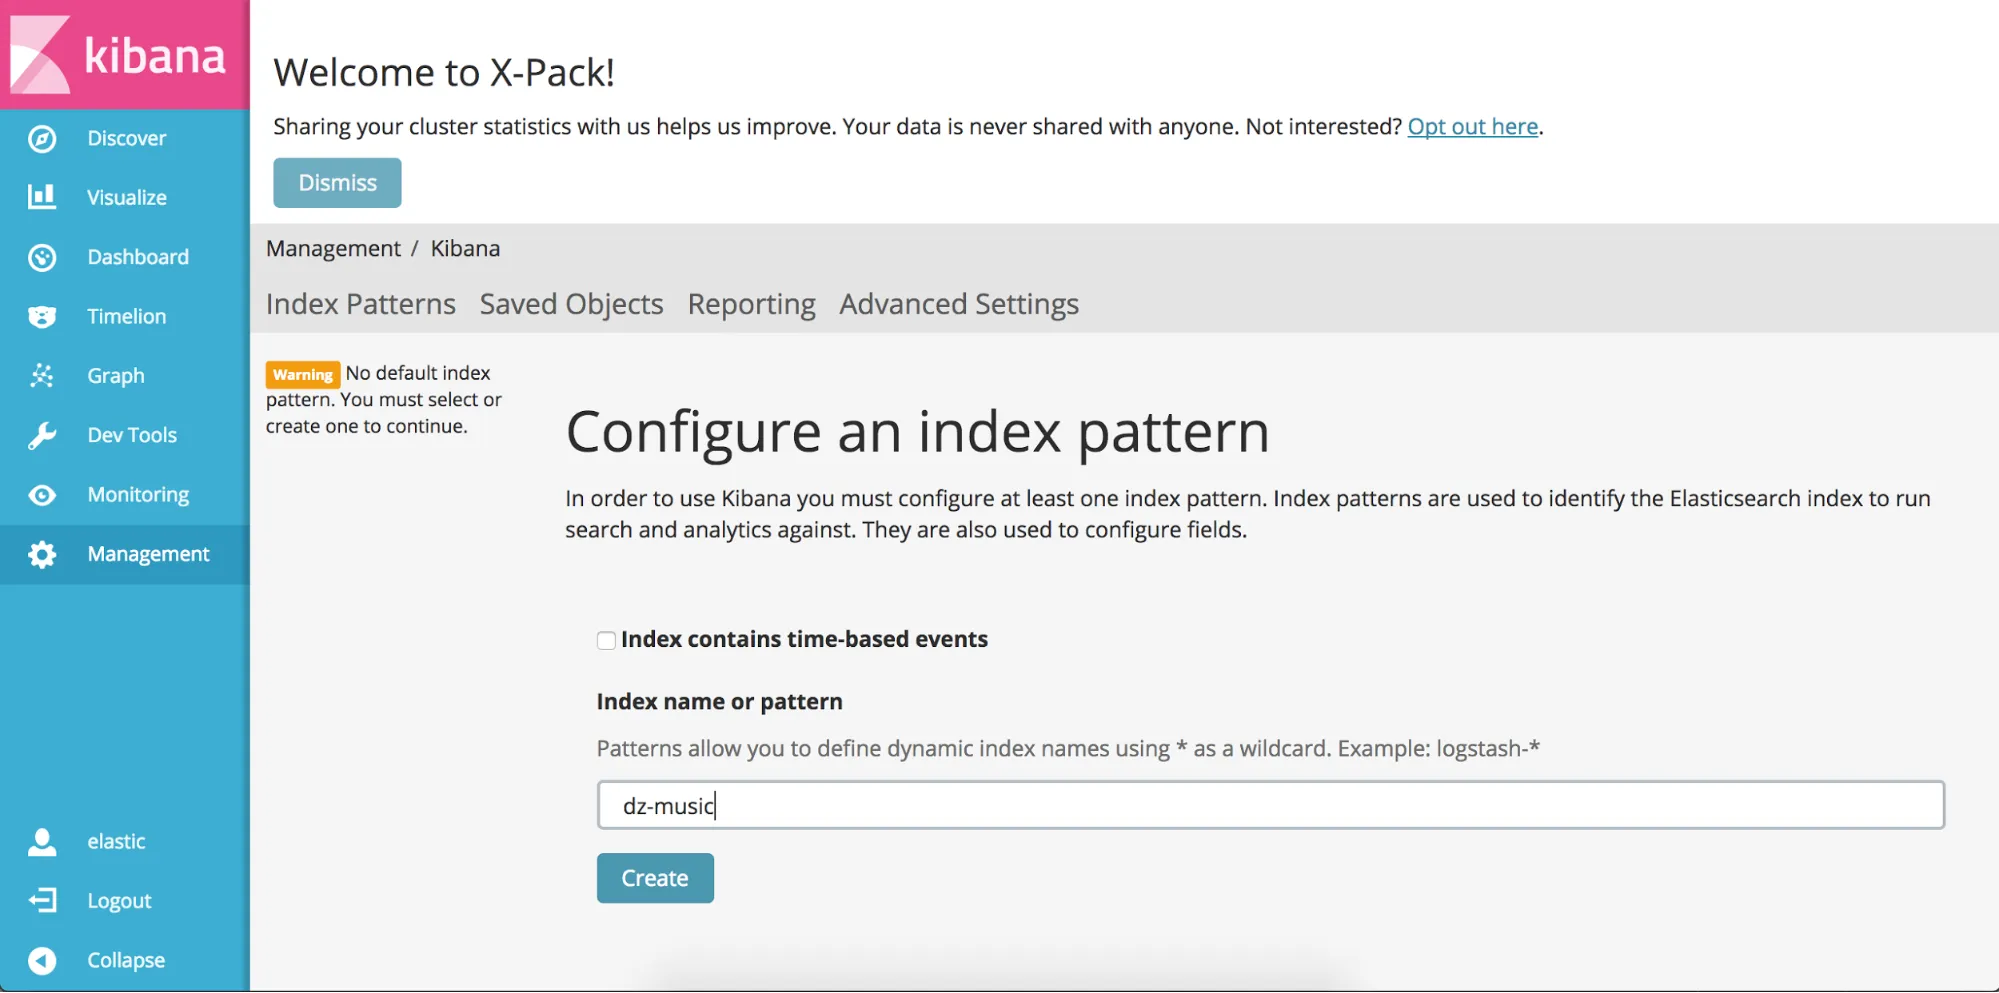
First you need to configure the index pattern. Go to the ‘Indices’ tab in the ‘Settings’ page. Untick the Index contains time-based events box and enter dz-music in the Index name or pattern text field.
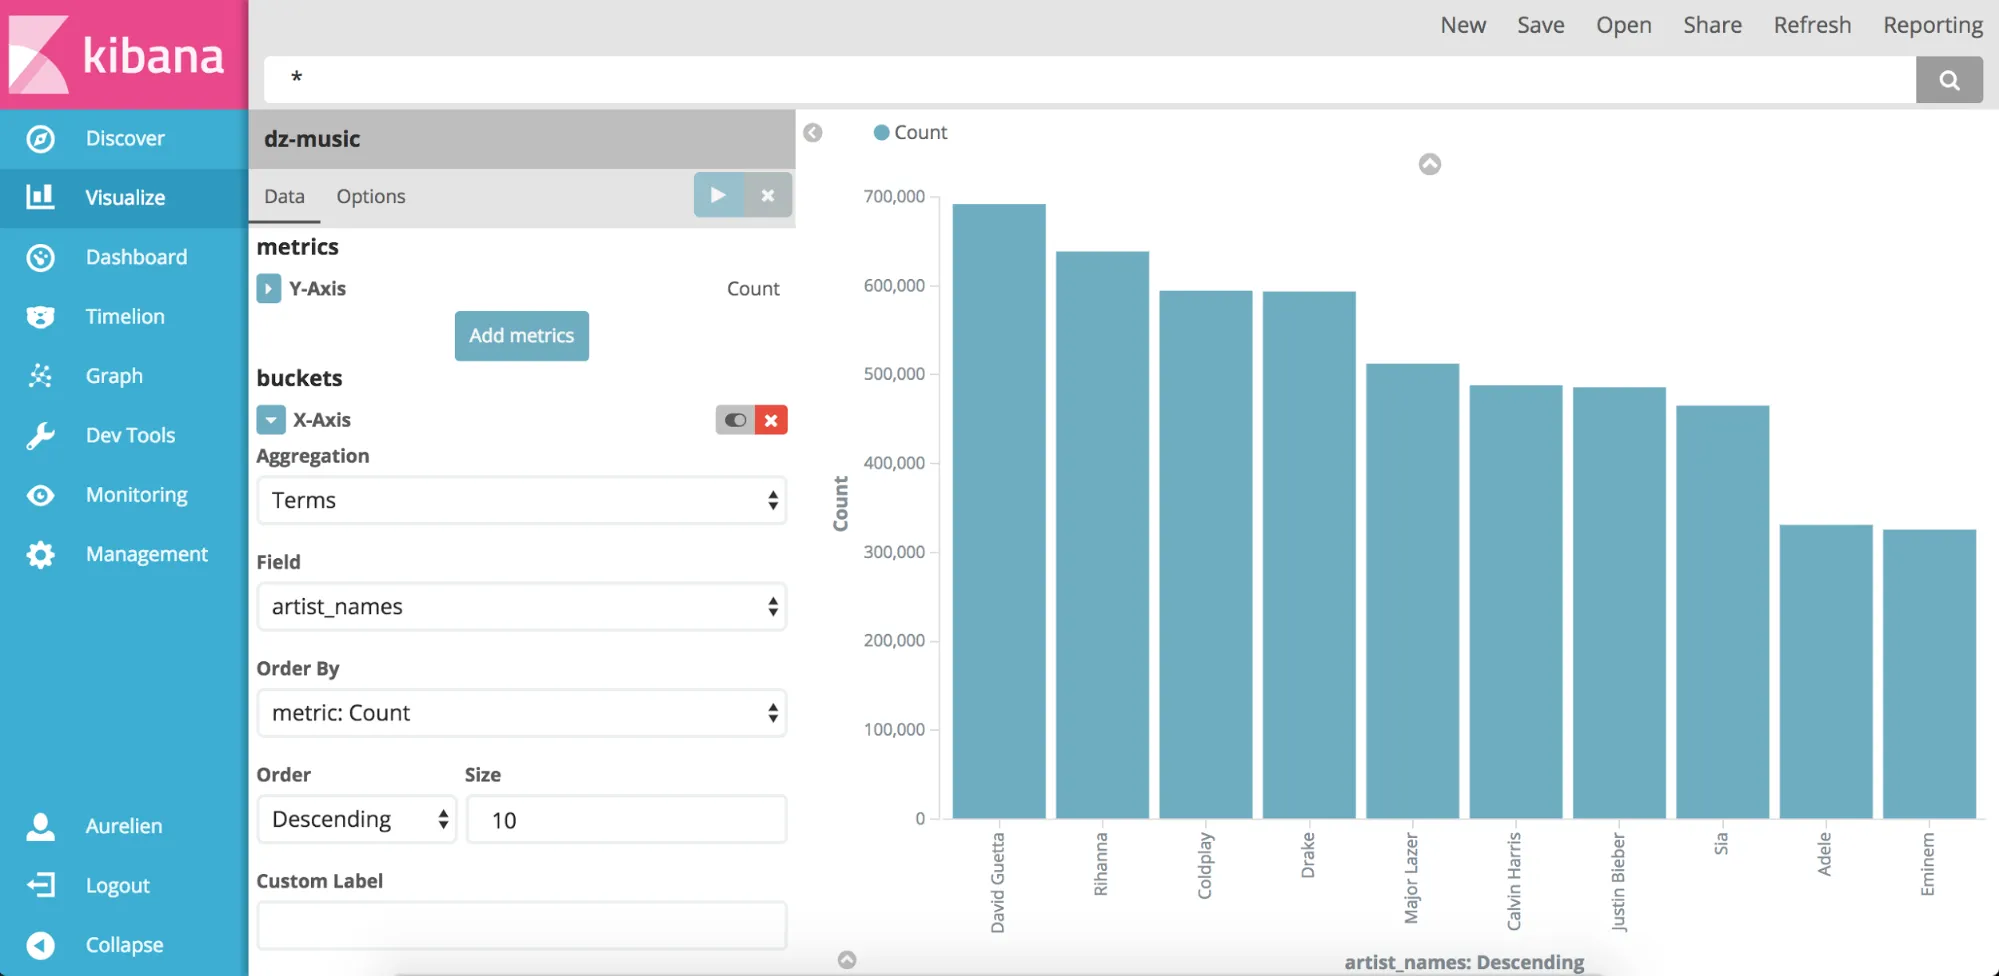
We want to create a visualization of the 10 most frequent artists in user profiles. So go to the ‘Visualize’ tab, choose the ‘Vertical bar’ chart and select the dz-music index pattern as a new search source.
Select the X-Axis as buckets and then select a Terms aggregation. Choose the artist_names field and set the size to 10. Click on the green arrow to apply changes. You should obtain a chart similar to this one (top artists depend on the sample data though).
Fun with Elastic Graph
It is finally time to play with Elastic Graph. It is a Kibana plugin that allows us to display a graph of our data.

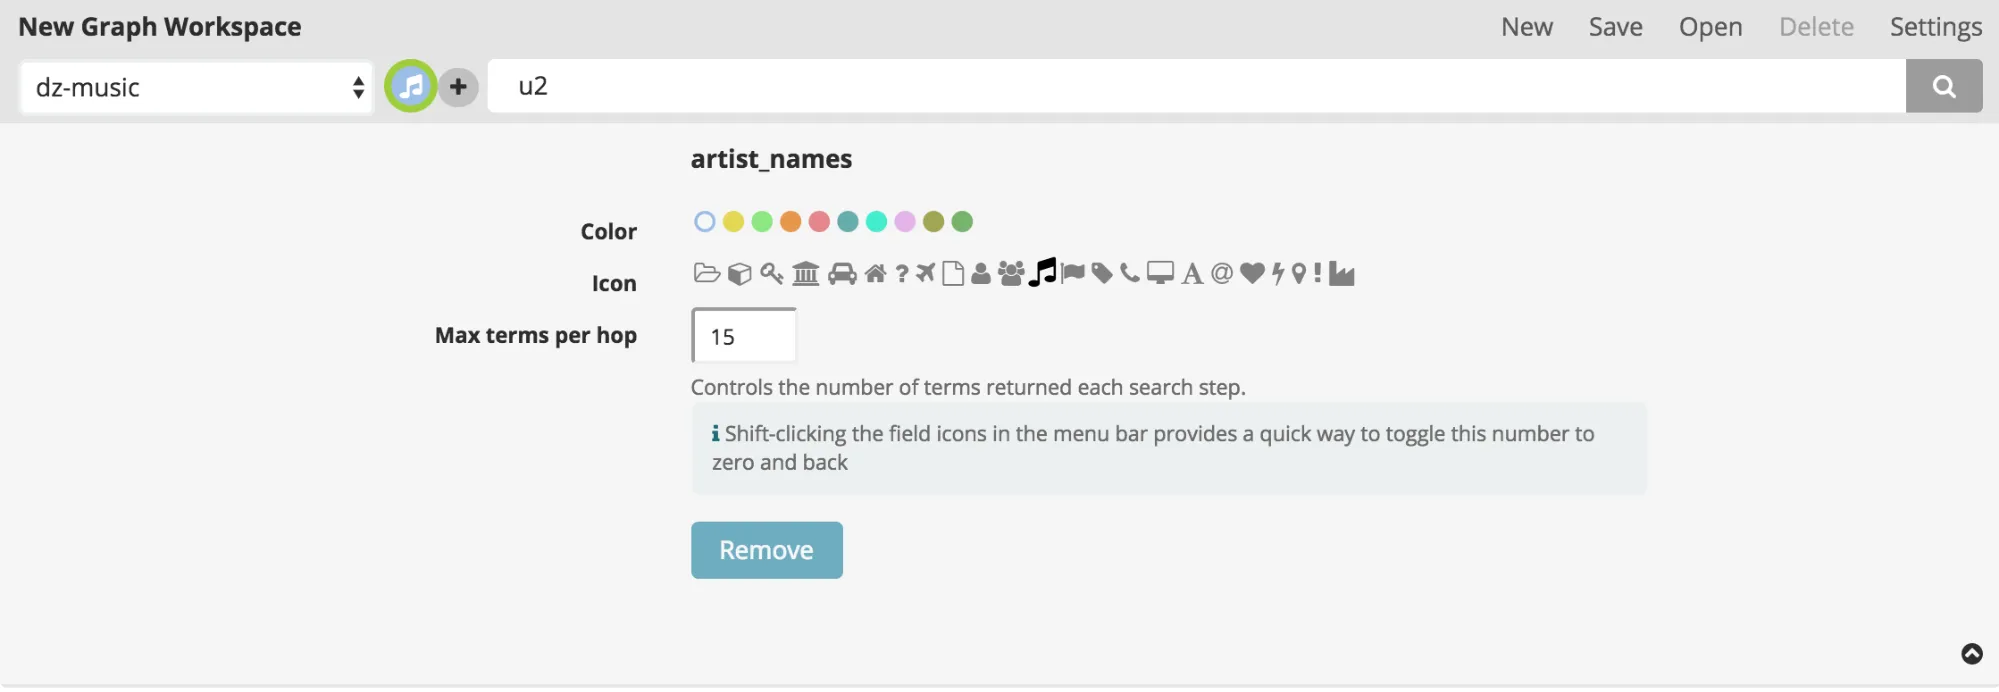
When you open the Graph application (see the screenshot above), getting started is as easy as counting to 3:
1. Select the dz-music index
2. Select the artist_names field that contains the artist names we want to graph
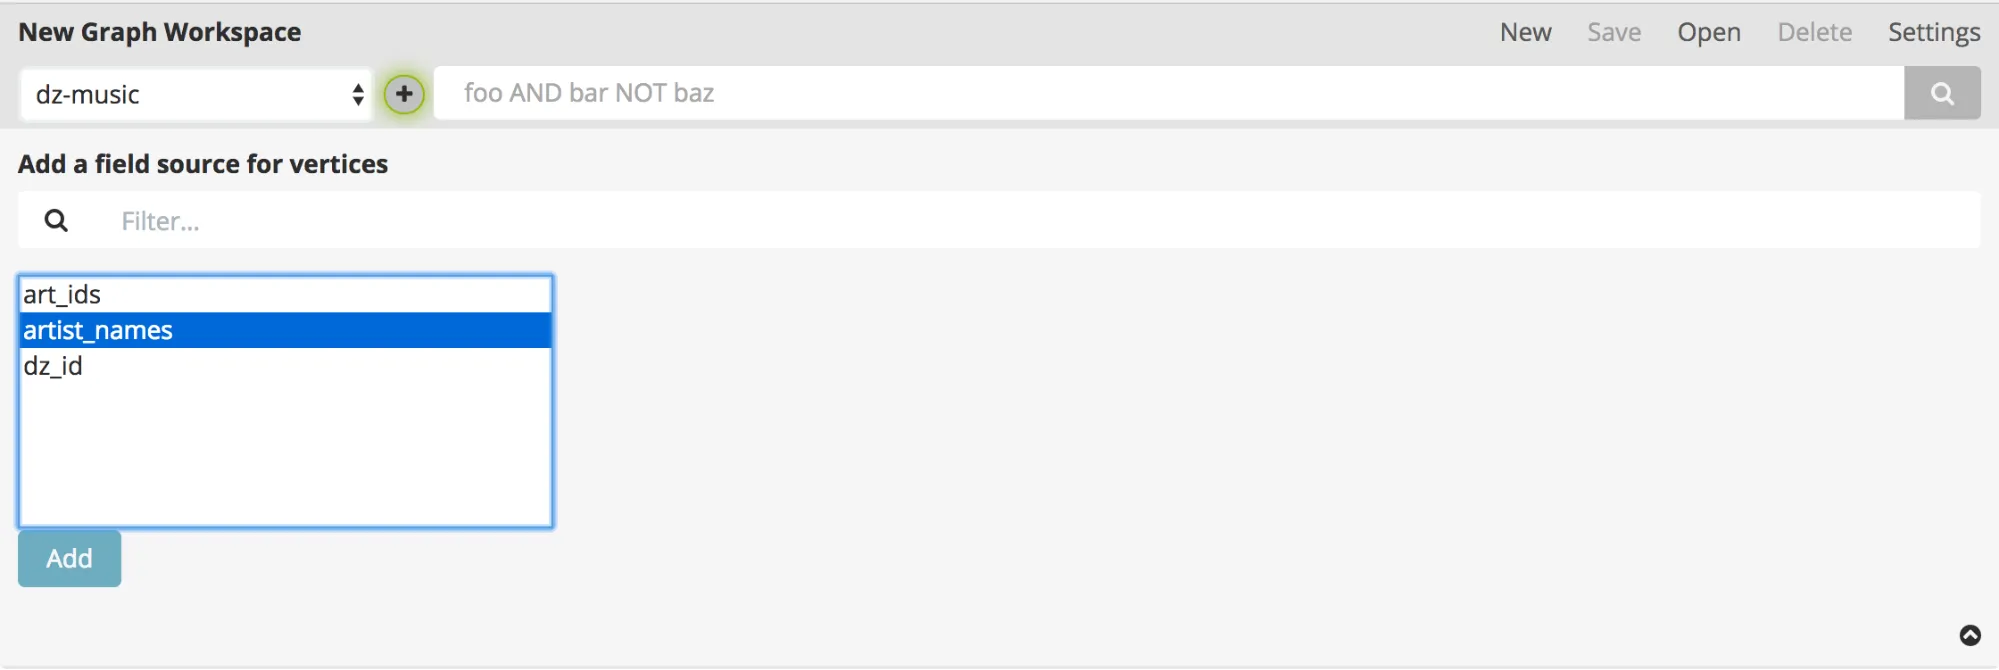
3. Configure the Max terms per hop (set to 15 for the example) parameter and search for an artist name
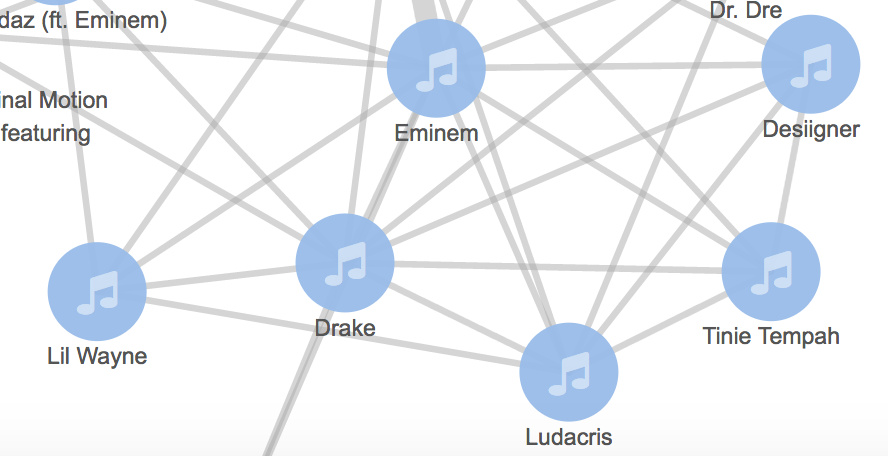
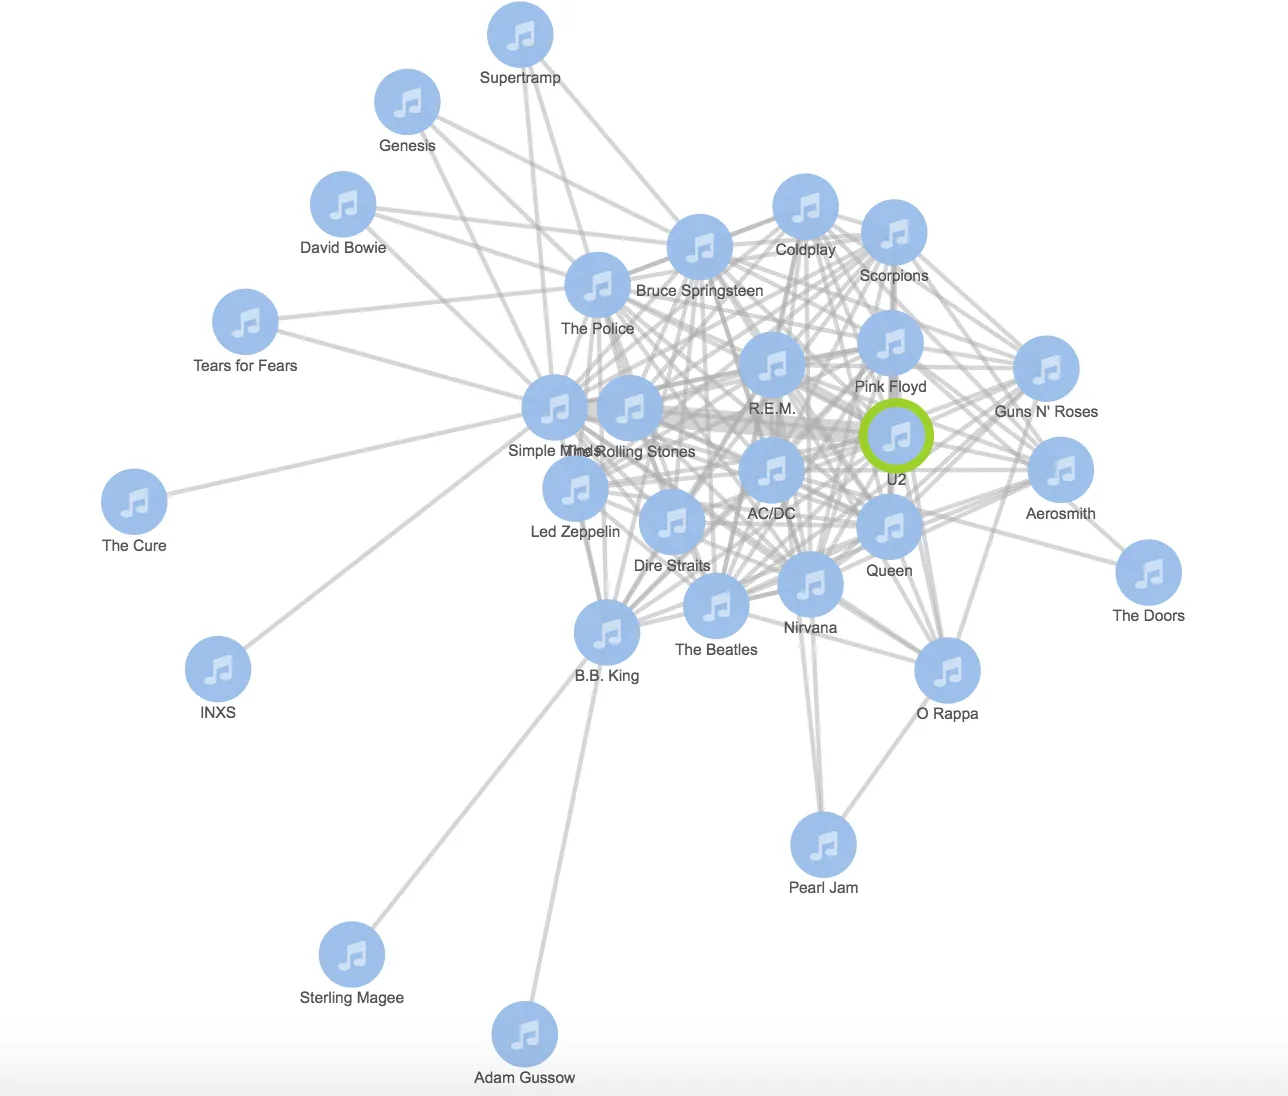
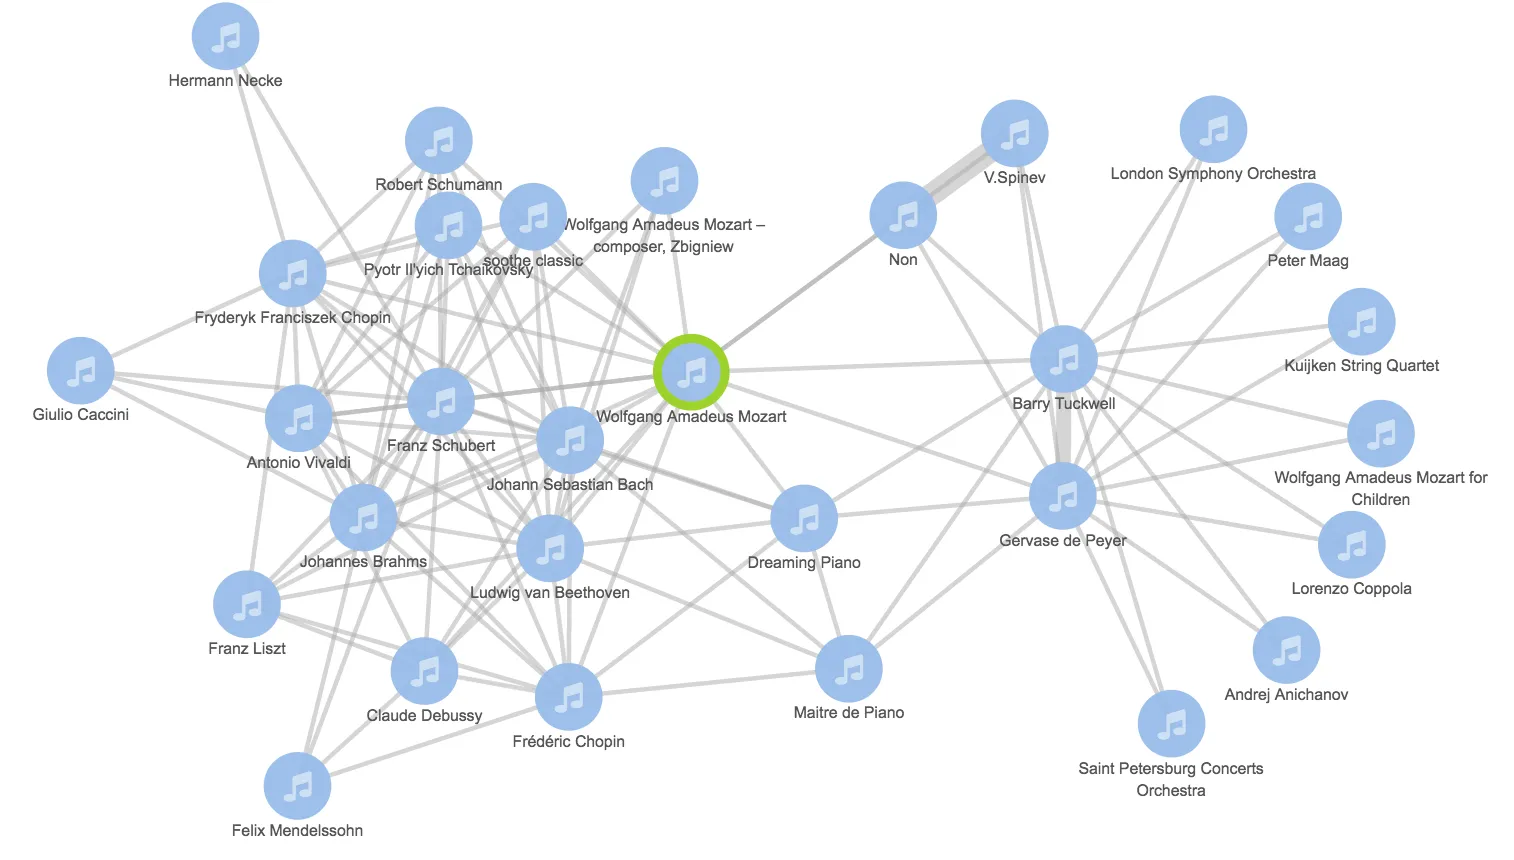
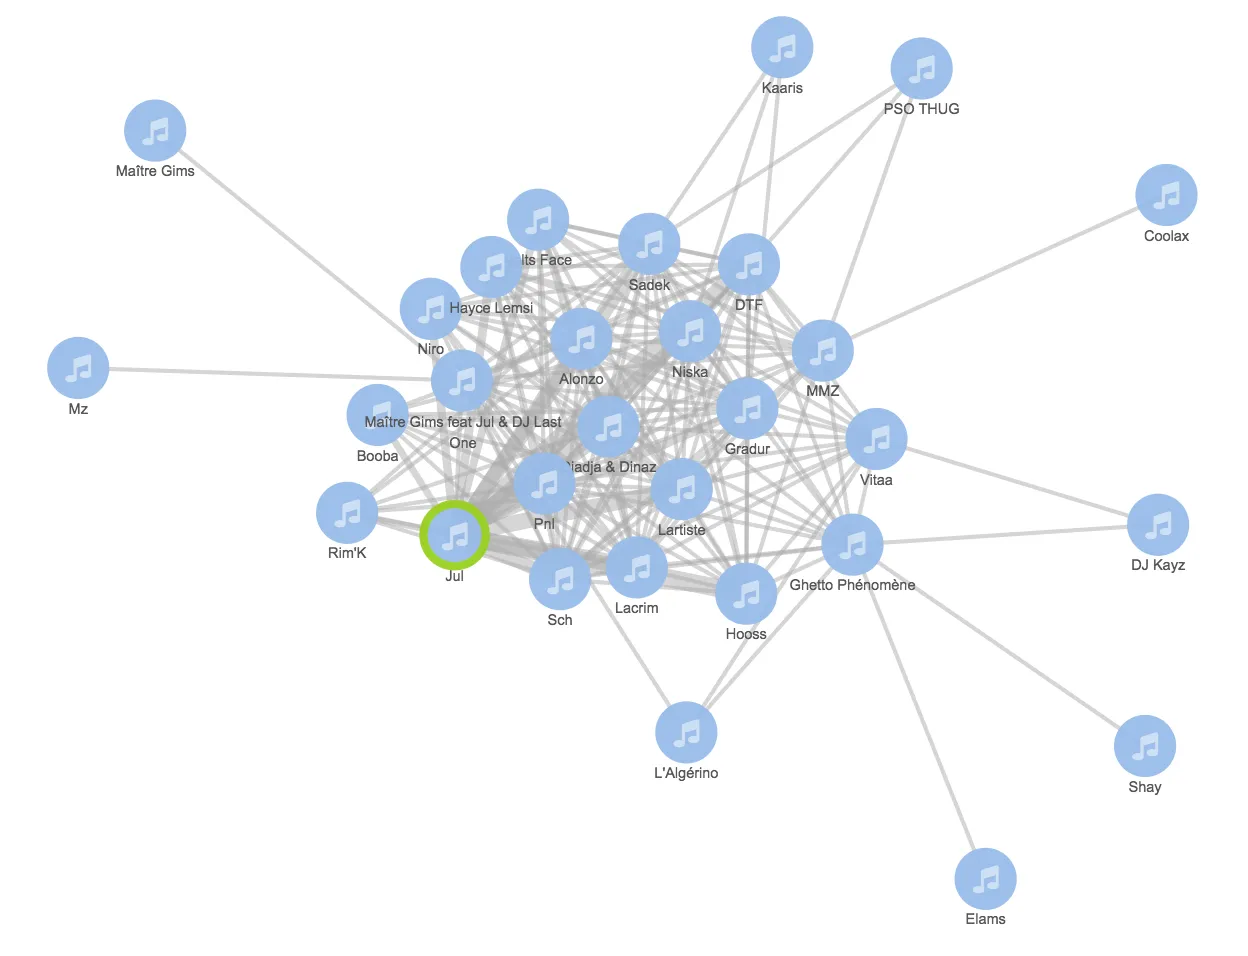
And voila! Here are some graph visualizations showing links between artists in various music genres:
Conclusion
This post is just an introduction to Elastic Graph and how to try it for free. If you are interested in going deeper into Elastic Graph, you can read the official Elastic Graph guide here.
