At Deezer, we take the world of music and make it personal. That’s why we designed Flow, your personal soundtrack, and a dynamic home page to help you find your perfect tracks in no time. But does personal content only revolve around music recommendation? Of course not! This article will show you how your listening habits can picture your unique music DNA.
In other words, we will here detail a simple process that transforms your listening history into a personalized artwork.
No more suspense, let’s get into it !
At the beginning: your listening data
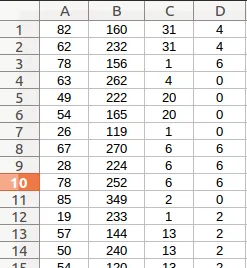
Let’s retrieve your listening history of the last 100 days. Nothing that the recent GDPR wouldn’t allow though! Just the precise date, genre of the songs listened to and how many times you’ve listened to the same song/artist.
— Wait, this is my music DNA?!
Of course! It’s still hidden in the table though, so the next steps will shape it in a more intuitive manner.
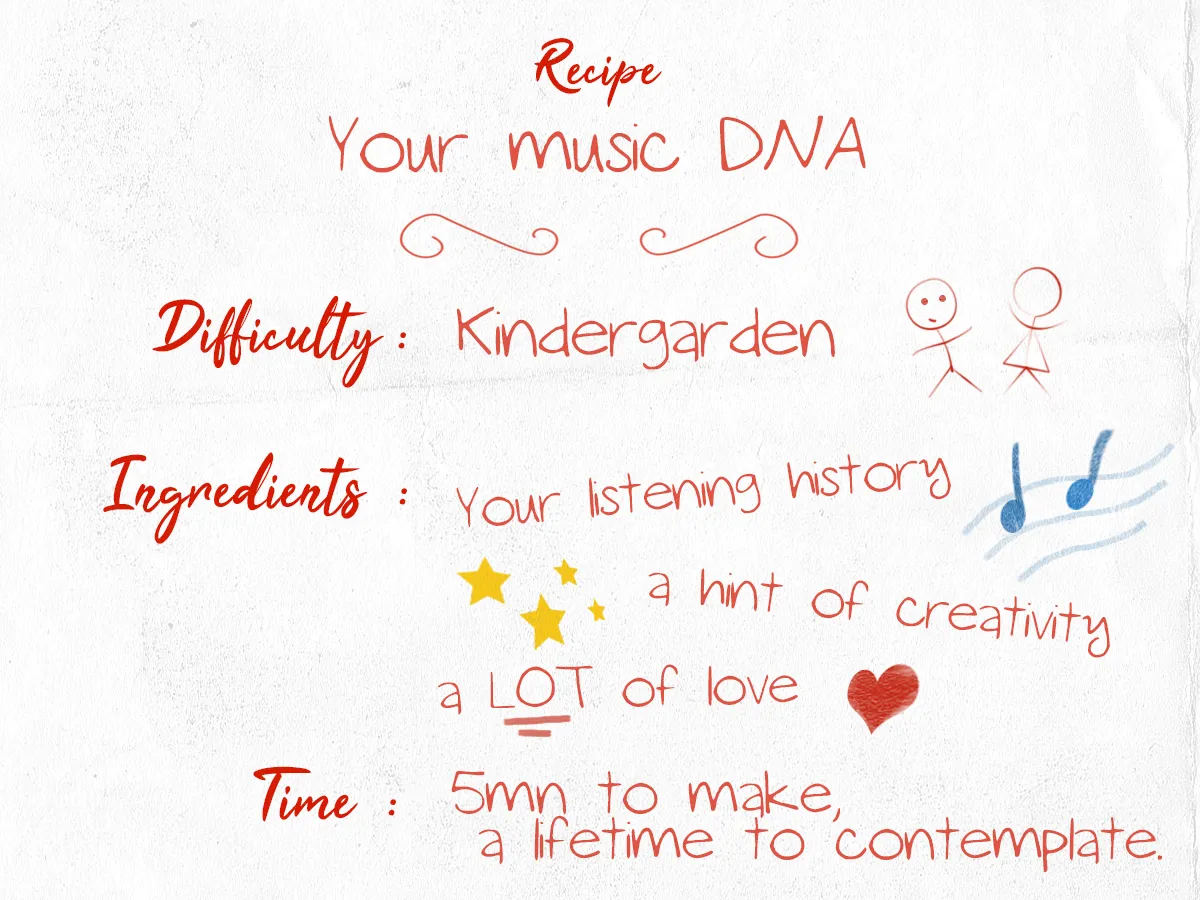
In the middle: a simple recipe
How to shape this table into something more recognisably DNA-y? Well, there are millions of possibilities! But for now, this simple recipe will do:
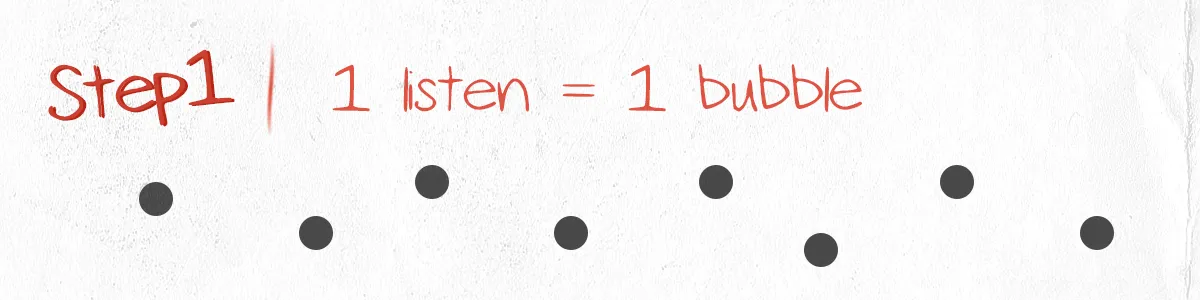
First, we need to put a body to those intangible listens!
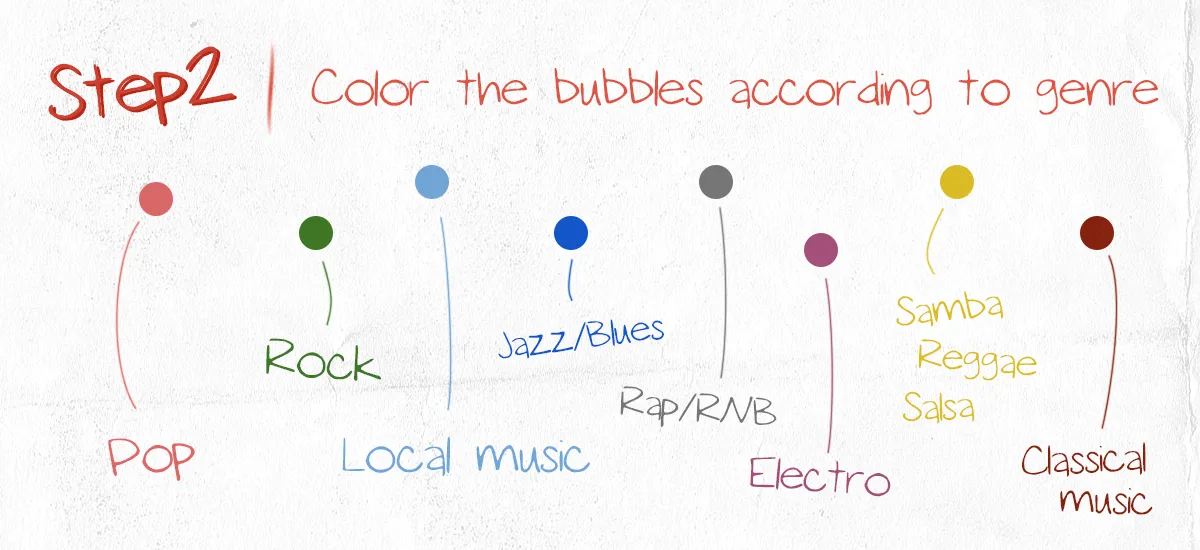
Hmmm ‘kay, keeping the same colour for all the bubbles is a bit boring, isn’t it? Let’s colour them according to the genre of the listen then:
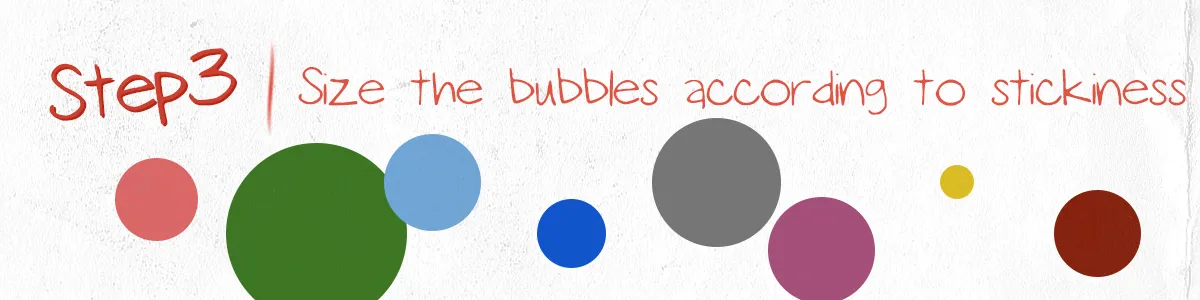
Better! Now the size of the bubbles is still not particularly clear. What if we resized them according to how much you’ve listened to the same content?
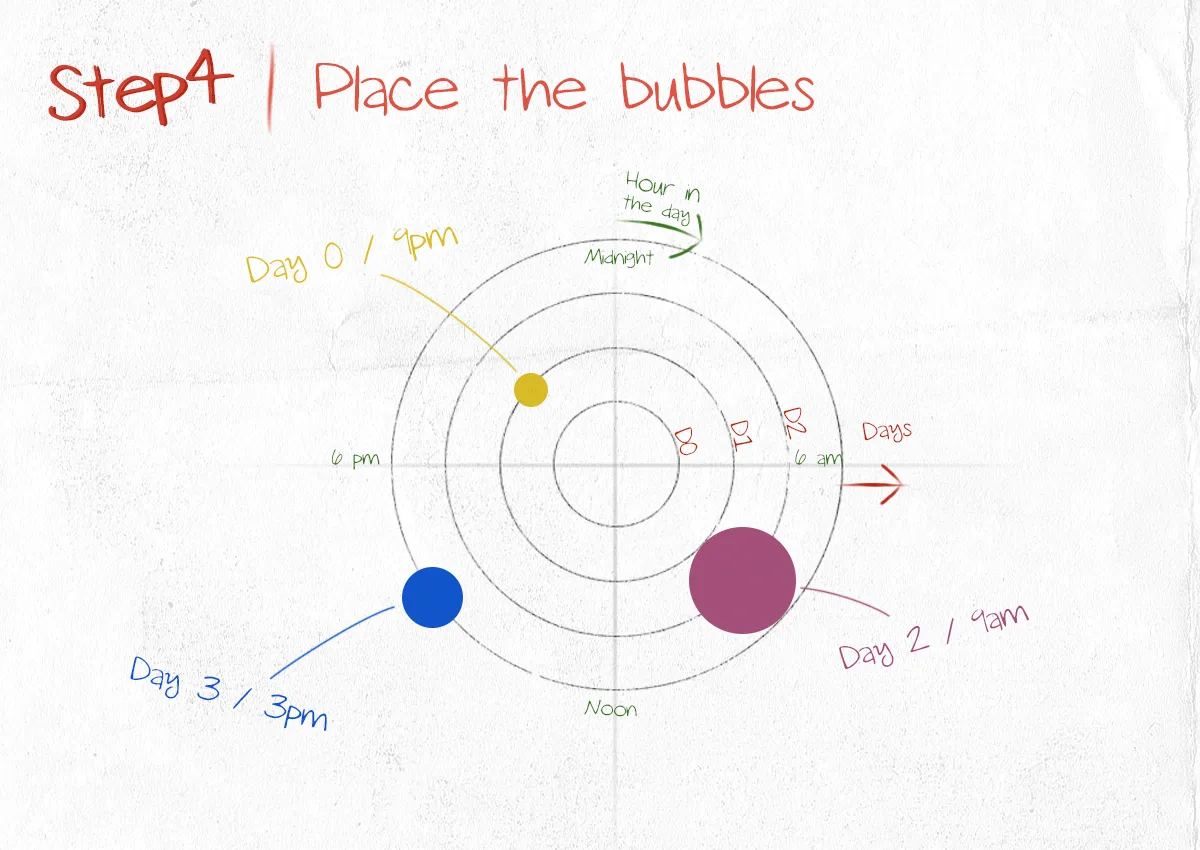
Eventually, we’ll need to position the bubbles by following some simple rules. No room for randomness here, we are telling your story! Straight timelines are intuitive, yet a bit too academic, so we chose to display the bubbles on an simple clock:
In the end, the magic happens
Voilà! I am pretty sure that at this point you are already imagining what it could look like. Let’s simply add some shiny post-prod glitter to it and output your personalized artwork!
An example :
A collection of generated artworks:

Backstage:
This project was made in the context of Deezer’s 2018 internal hackathon. I was inspired by this very nice article.
We used the processing library to make the script that automates the artwork’s creation, after data were extracted from our cluster with Apache Spark.
(Do you know other libraries that could have worked as well? Let us know in the ‘Comments’ section!)
Now be the chef!
What did we miss? Do you have any other recipe ideas? You can play with the toy code we made, which I uploaded on my personal github. Please let us know what do you think in the ‘Comments’ section!
Hope you liked it!