

Software Engineering is often all about automating what can be automated. That’s why we build cron jobs. cron is a utility that can be found in any Unix-like system, used to schedule tasks and commands that need to be executed repeatedly (i.e. every hour or every day). For example, we often need to make regular calls to an API to update a database with new info, and we don’t really want to have to think about doing it manually every day. A cron job is the perfect format for doing so. However, monitoring the health of a cron job can be complicated and it’s really easy to just forget we have cron jobs running (or trying to) continuously.
Monitoring, monitoring everywhere
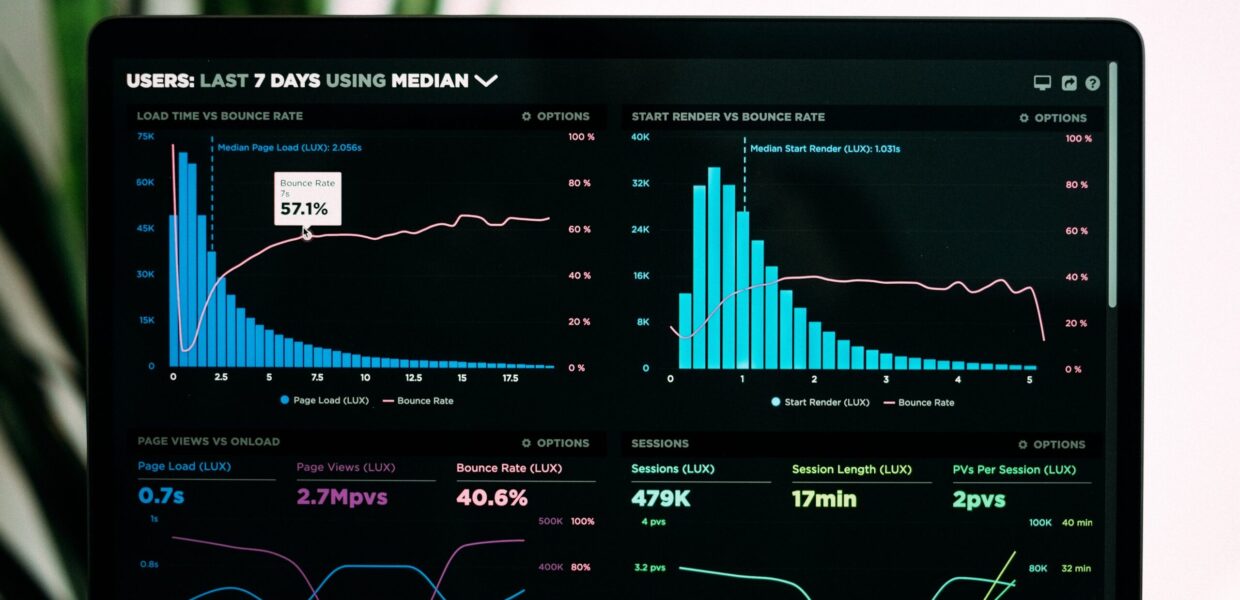
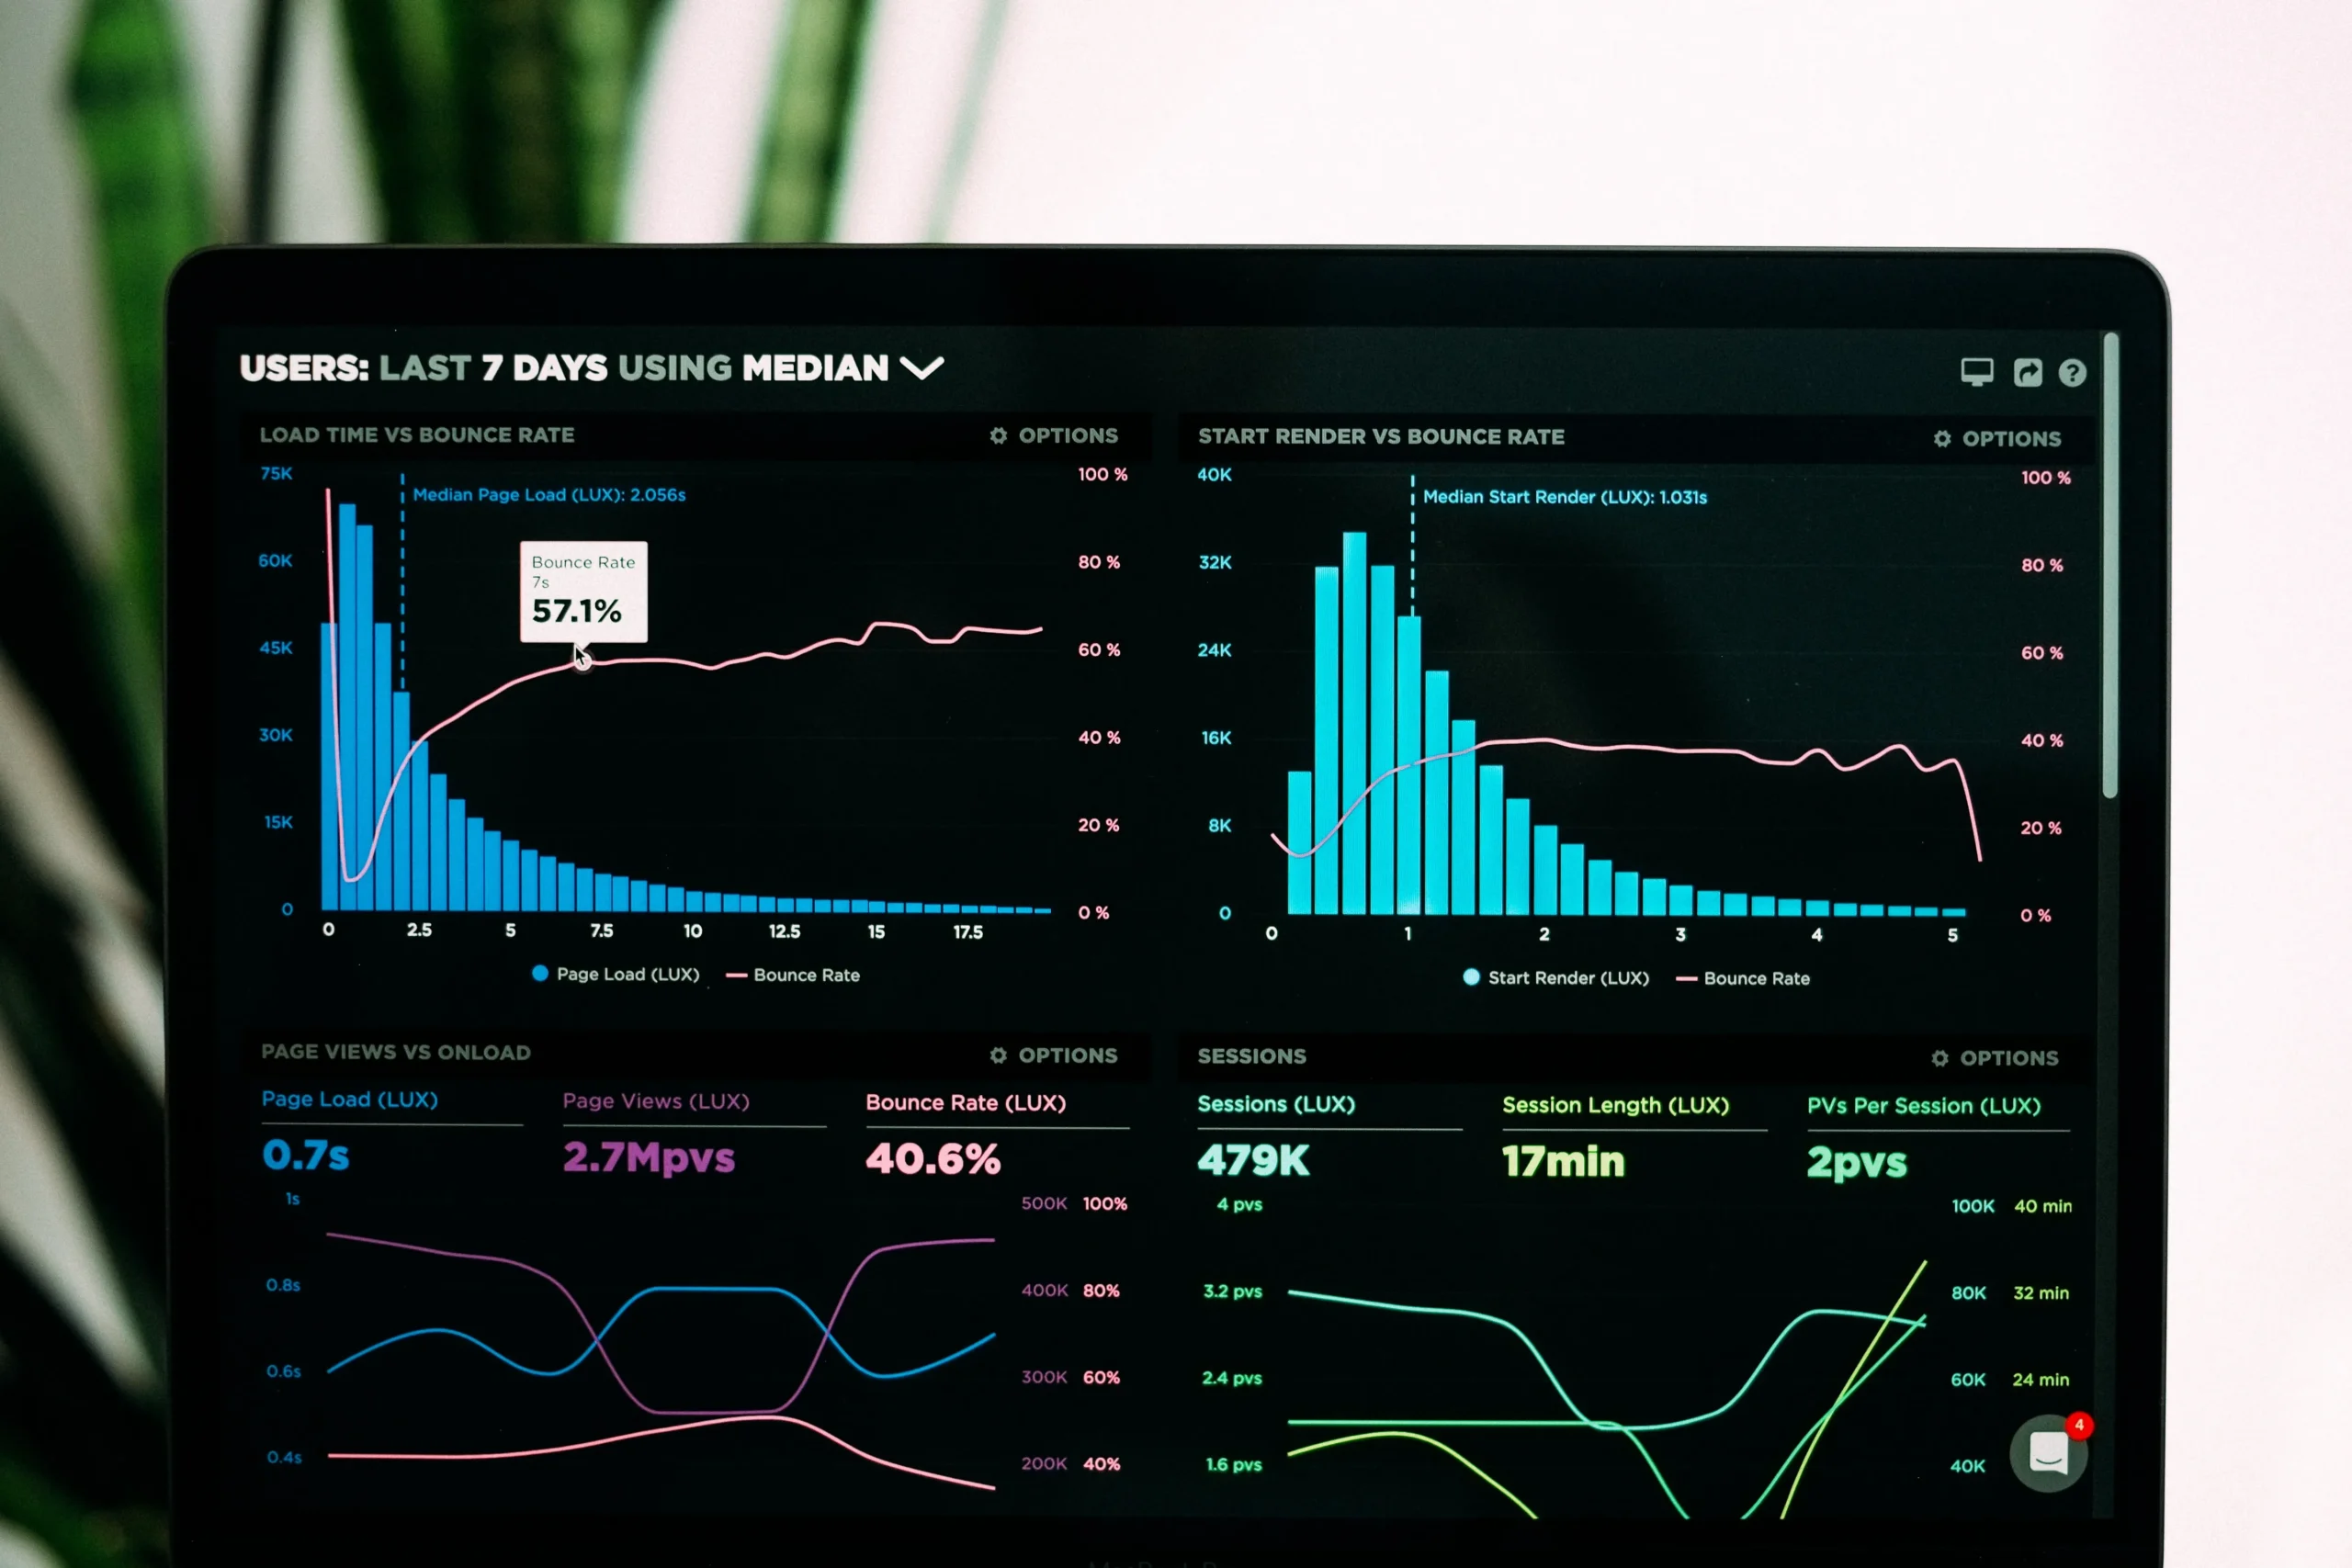
In order to improve performances and make sure our programs are running smoothly, we need monitoring one way or another. From network, to execution time, to the number of requests, there are a billion vitals we can and want to monitor. A lot of software offers simple ways to do so, like Datadog, Prometheus or Grafana.
Often, monitoring works by scraping vitals from servers or containers, and making requests to them. But cron jobs are programs that are supposed to run once for a short time, and monitoring can’t guess exactly when the cron runs in order to request metrics from it. In that case, how can we make sure that our cron ran correctly? Well, if we use Kubernetes, we can always go to the dashboard and search for that cron and look at the logs. But there is no way to make sure that someone will think about doing that, because humans tend to be forgetful and software engineers simply have too many things to think about already! Bottom line, if it can be automated, it should be.
The Pushgateway
Prometheus has a service that allows to push metrics from jobs that can’t be scraped: the Pushgateway. The way it works is pretty simple: it serves as a middleman between Prometheus and the cron job. Instead of Prometheus making requests to the job to get metrics, the job can push metrics to the Pushgateway when it’s executing, and then Prometheus will make calls to the Pushgateway to get those metrics. Then, we can visualize those metrics in a Pushgateway board, and create graphs and alerts from them with another service like Grafana, for…