

This summer, I upgraded a project from Node 18 to Node.js 20. The code was not that old, and I did not expect any problems… But as with every Node.js upgrade, unexpected behaviors happened.
Why upgrade?
It is common practice to keep projects up to date. Lagging behind too much may increase the work needed to upgrade when the choice isn’t yours anymore.
I could have waited, but I had some time to do it.
Node.js 18 is currently in “MAINTENANCE”, which means there are security fixes but no more new features. Maintenance is set to end in June of next year.
Node.js 20 is the current LTS version available. It is in active development and will enter its maintenance phase next year.
Soon after the next LTS (Node.js 22) is released, a migration will be scheduled (and maybe another post?)
How?
This part is pretty simple: change a few versions values in the `package.json` file, then run “npm install” as usual.
All dependencies versions are managed by renovate bot. Therefore, “package.json” only contains the exact versions of each dependency.
The version is set to Node “20.15.1” because it was the very last version available at the time of the upgrade. Any future minor upgrade will be done automatically without changing anything in the “package.json” file.
Docker images are built regularly and target the latest version of Node.js 20 like a rolling release.
Deployment and first results
This is a critical project, but deploying it is usually simple and quick. No one fears its deployment. But as this was a potentially impactful upgrade, I paid more attention than usual.
Project vitals
The main dashboard I look at during a deployment is the project’s vitals. It contains all the required metrics to know at a glance if the project is healthy or not. I won’t go into details here for confidentiality reasons, but I can show you the response time goal of the project:
The purple vertical line is roughly when the deployment occurred. You can see the response time went up. Note: Given that the purple line is not displayed on all graphs, follow the red arrow instead. The graph shows the percentage of responses that match one of the three response time goals we follow. Requests faster than 100ms went from 96.8% to 96.1% — a minor defeat at the first battle.
Sure, we can agree that losing around 1% is perfectly acceptable, but it shows that something happened.
Looking at the average response time, we can see the increase more easily. It went from ~23ms to ~28ms.
I then looked at all the other graphs, metrics, and logs. After validating and considering the project as healthy, it was time to dig in to understand what was happening. As there was no immediate threat to the project’s stability and the response time was still well above the budget thresholds, I could take some time to dig deeper; otherwise, a rollback would have been in order.
System vitals
The project is running on a Kubernetes cluster. I have access to the cluster’s metrics and can see the pods’ CPU and RAM usage. Those unfamiliar with Kubernetes can consider a pods like one Node.js process started inside a Docker container.
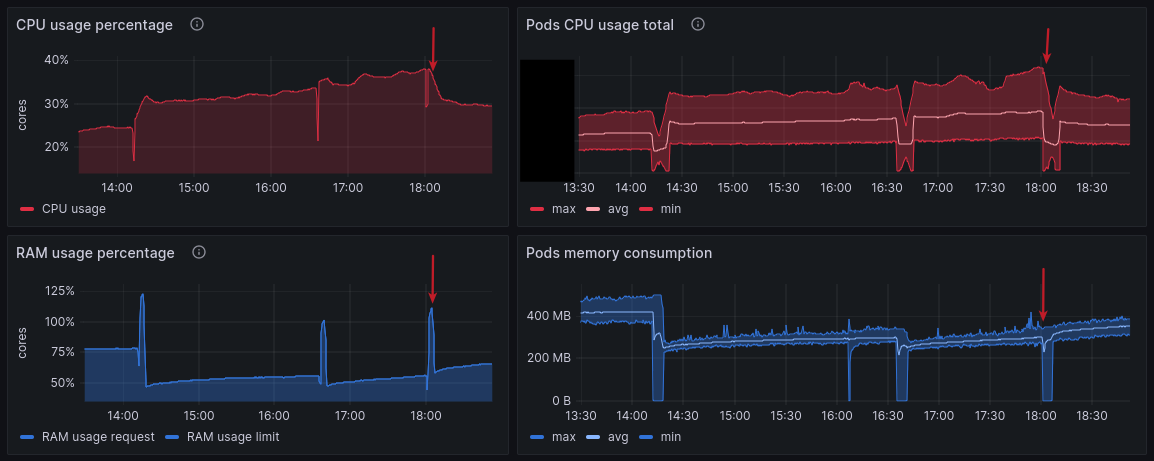
CPU increase
I noticed an increase in CPU usage, going from 24% to 30% of the reservation after the deployment — another defeat.
In Kubernetes, we set CPU and RAM reservations. It is a good practice to indicate to the cluster how many resources the pods will need.
For example, we can define that one Node.js process can use up to 2 CPUs.
The graph then shows how much of these two CPUs is used compared to the reservation.
The same applies to RAM. Of course, the graph shows values for the entire cluster, not only one pod.
limits:
  memory: 512Mi
requests:
  memory: 512Mi
  cpu: 2
This is an example of a configuration for a pod. This means the pod will have two CPUs and 512Mi of RAM at its disposal.
Memory usage decrease
The memory usage went down. A small victory!
This project always loses weight after each deployment. It is normal, and it gains it back after a while. It takes a few hours to stabilize, but here, it went down more than usual, and at first glance, it will likely stay like that.
Node.js vitals
The first Node.js metric I was interested in is the Event Loop Utilization (ELU).
This metric is essential to understand the health of a Node.js process. It basically shows how much time the process is spending doing work in the event loop, from ~0% for an idle process to 100% for a process that is always executing JavaScript code.
The graph shows a slight increase after the deployment, going from 17% to 20% on average. A defeat, again! It is not really surprising as we know the CPU usage increased, but we can clearly see that it had a (small) impact on the JavaScript code running. This may be the reason for the increase in response time.
After that, I looked at the HEAP and the Garbage collector statistics. They both make sense together.
We lost weight on the HEAP, but something is happening with the Garbage Collector. The minor GC is running more often and is taking more time.
Without going into too much detail, the minor GC is a process that targets newly created objects in the HEAP. Another one (the Major GC) targets all “old” objects.
The Minor GC is a fast process that runs often. It is normal to see it called at high volume. However, something changed after the upgrade as we went from a few calls to thousands of them. Even if it is a fast process, it ate up almost 4 seconds of CPU time on the entire cluster. By comparison, we were only eating up less than 1 second before the deployment.
This increase in GC can easily explain the CPU usage and part of the ELU increase, which results in a slower response time.
I might have my culprit here.
Issue identified, now what?
Ok, there is clearly something going on with the Garbage Collector. But what is it?
If we look at the HEAP in detail, there were a few notable changes after the deployment:
The map HEAP space disappeared, and the shared spaces appeared. But most importantly, the new space went from ~33MB to ~8MB.
Do you remember what I wrote a few lines back?
The Minor GC targets newly created objects in the HEAP
Is this the reason why the GC is now running so often? I think a smaller space means more frequent GC runs because when the space is full, the GC needs to run to free some space. If the space is smaller, it will become full quicker and run more often.
Why is the new space smaller?
There is no configuration of the HEAP that targets the new space in the project. This means Node.JS itself probably changed between versions 18 and 20. But there is one HEAP space that is configured: the old space. We run the server with the following command:
node - max-old-space-size=300 dist/server.js
I don’t know if this impacts the new space as well. I started searching for references to the new space in the Node.js release notes. At first, I found nothing relevant, but after a while, I made the link between “new space” and “semi space.” The V8 engine under the hood of Node.js uses this wording instead of “new space.” And sure enough, I found a change in the Node.js 19 release notes: https://github.com/nodejs/node/pull/44436
The parameter “ — max-semi-space-size” was added because it was itself added to the V8 engine. By following breadcrumbs, I finally found these changes in the V8 engine: https://chromium-review.googlesource.com/c/v8/v8/+/1631593 and https://chromium-review.googlesource.com/c/v8/v8/+/4384482
These changes modified the way the max-semi-space-size is computed. I’m no C expert, but by simply reading comments and some parts of the code, we can see that the new space’s size has changed. The new value is now computed from various others. Unfortunately, I could not find how it is computed exactly as my C++ is a bit rusty, and V8 is not a simple project. I can only make hypotheses at this investigation stage; one is that the new space’s size is computed in relation to the old space’s size.
The first change was introduced in V8 10.6 and is now part of Node.js 20, which uses 11.3. For reference, Node.js 18 was using V8 10.2.
This means that going from Node.js 18 to 20, we also went from V8 10.2 to 11.3.
A workaround?
The “new” HEAP space is now computed differently. Upon the upgrade, it went from ~32MB to ~8MB. It is most likely the reason why the GC is now eating up so much CPU time compared to before.
A new parameter was introduced to specify the “new” space’s size: “ — max-semi-space-size.”
I tried to set it to the previous value and see if it solved the issue.
I changed the command to start the server to:
node - max-semi-space-size=16 - max-old-space-size=300 dist/server.j
The value “16” comes from the documentation itself.
- max-semi-space-size=SIZE (in megabytes)

Sets the maximum [semi-space][] size for V8's [scavenge garbage collector][] in
MiB (megabytes).
Increasing the max size of a semi-space may improve throughput for Node.js at
the cost of more memory consumption.
[…]
The default value is 16 MiB for 64-bit systems and 8 MiB for 32-bit systems.
[…]
Let’s deploy this simple change and see if it works.
The response time has gone back to the previous values. It’s a win!
The CPU usage is also back to normal, and the RAM usage is still lower than before. It’s a double win!
Finally, we can see that the GC went back to a “normal” behavior. Also, the new space is now back to its original value. It confirms my hypothesis that the new space’s size was the issue.
What happened?
At this point, the issue has been solved in production. But I still need to understand what exactly caused the new space to shrink like this. I hypothesize that the `max-semi-space-size` is now computed in relation to the old space’s size. Since we specify a ` — max-old-space-size` of 300MB, a relatively low value for Node.js, it would not be surprising that it significantly impacted the “new” space’s size and caused it to shrink that much.
Let’s build a lab project to test and confirm this hypothesis.
Lab project
I found a basic HEAP consumption script online and used the standard “V8” module to obtain HEAP statistics.
Here is the resulting script:
const v8 = require('v8');

// Dumb function stolen somewhere on the internet and modified to allocate
// lots of new objects. A bit barbaric, I know, but it does the job.
function allocateMemory(size) {
    // Simulate allocation of bytes
    const numbers = size / 8;
    const arr = [];
    arr.length = numbers;
    for (let i = 0; i < numbers; i++) {
        arr[i] = {"test": Math.random()};
        arr[i][`${Math.random()}`] = Math.random();
    }
    return arr;
}
// We allocate memory to trigger the garbage collector
// & force the HEAP to grow, including the `new_space`
allocateMemory(1000000)
const heapSpaces = v8.getHeapSpaceStatistics()
console.log(
    heapSpaces.filter(item => item.space_name === 'new_space')[0].space_size
    / 1024 / 1024 // We display the value in MB for convenience
);
When running this script, the output will be a single number representing the size of the “new_space” in MB. Before outputting it, I ensured that this space was grown to its maximum value by allocating objects in memory.
$ node test.js
32
Now, let’s run this script with the “ — max-old-space-size” set to 300MB using Node 18 and then Node 20.
$ nvm use 18
Now using node v18.20.4 (npm v10.7.0)
$ node - max-old-space-size=300 test.js
32
$ nvm use 20
Now using node v20.15.1 (npm v10.7.0)
$ node - max-old-space-size=300 test.js
32
The “new_space” size is the same for both versions. I was clearly wrong.
Of course, doing the same without the “ — max-old-space-size” gives the exact same result.

What is going on? Why is my project behaving differently? At this stage, I can’t understand the reason why.
After more searching in V8 code and, most importantly, a hint from one of my colleagues Zibok, I may have a new hypothesis related to the memory reservation in the Kubernetes configuration.
The hypothesis now is the “new_space” size is computed in relation to the memory reservation of the pod.
Without going into details, Kubernetes memory and CPU reservation are done through the Kernel.
Meaning that what is actually enforcing the reservation is the Kernel itself. It is applied directly to the process running inside the pod via the cgroups.
Therefore, the process itself can be aware of the limit and adapt.
I could test that in a Kubernetes Cluster, but there may be an easier way to test this hypothesis. Sure enough, Docker allows setting memory reservations, too, via the “— memory parameter”. More on that here.
Firstly, the results without memory reservation:
$ docker run -ti - rm -v ./:/ node:18 node /test.js
32
$ docker run -ti - rm -v ./:/ node:20 node /test.js
32
These results show the exact same result as before, as expected.
Then, with limits:
$ docker run - memory=512m -ti - rm -v ./:/ node:18 node /test.js
32
$ docker run - memory=512m -ti - rm -v ./:/ node:20 node /test.js
2
Finally, we have a different result. The “new_space” size is now 2MB. It confirms the hypothesis that the memory reservation is used to compute the “new_space” size.
I now have my culprit. The memory reservation in the Kubernetes configuration is the reason why the “new_space” size shrunk so much.
Conclusion
The overall upgrade to Node.js 20 is a win. The global memory consumption is significantly lower than before, and apart from the few moments when the “new_space” size was too small, everything worked flawlessly.
When using Node.js in a Kubernetes environment, and more broadly in a containerized scenario, you must consider the memory and CPU reservation. It needs to be configured in order to set limits to your process that would otherwise consume more than you expected. Also, setting it to low values requires attention to ensure the process accommodates the limit appropriately.
Today, we saw that setting RAM limits on a process also impacts how much it will allow itself to consume. Production services with high loads or receiving tons of requests can impact performance and latency. If I had not monitored the metrics, we would have missed our target response time, dropping by a whole percent! A shame, I know.
The impacts of CPU limits on Node.js processes would make good material for a next post, as I observed surprising effects when I did some tests a few years ago. Maybe I’ll write about it in the future… So keep your eye on the blog!
In conclusion :
In Node.js, HEAP space is now (since Node 19) sized in relation to the memory limits of the process (among other things).
In a Kubernetes/Container context, where setting RAM limits is a common practice, it can unexpectedly impact the performance of your Node.js process.
The “ — max-semi-space-size” parameter must be considered in those scenarios.
Many thanks to Pauline Munier and Gillian Kelly for their help in writing this article.
You can also find this article (and more) on my personal blog:
https://blog.ztec.fr/en/2024/post/node.js-20-upgrade-journey-though-unexpected-heap-issues-with-kubernetes/
Note: A French version of this article is also available on the blog: https://blog.ztec.fr/2024/post/node.js-20-aventure-inattendue-kubernetes/